No sh*t Sherlock - Responses to Haringey Low Traffic Neighbourhood surveys show they are exclusive by design
- By Brian Leveson
- •
- 30 Dec, 2022
- •
Summaries of key demographic information show the bias of the consultation results towards towards young white men who are in favour of the road closure schemes

Bounds Green LTN
The consultation for the Bounds Green LTN ran from 16th August 2021 to 17th September 2021. In total 1,511people responded to the consultation –1,388 via the online portal and 123 via paper surveys. There were also 57 emails received with feedback on the scheme.
Summary of key Demographic information
· There was similar sentiment from residents in both the Bounds Green LTN area in Haringey and the Enfield LTN area, although those in Enfield were slightly more negative. Residents from Haringey but outside the LTN area were more positive about the changes than those within.
· Residents living on boundary roads around the Bounds Green and Enfield LTN area had a similar sentiment towards the changes to those living within the LTN area.
· Respondents with access to a private car were more negative than those without access to a private car.
· Those who currently travel around the area by car were more negative about the changes than overall. Those who travel around the area by cycle were the most positive group when broken down by travel mode.
· Respondents with a physical or mental health condition/illness were more negative about the proposals than those without.
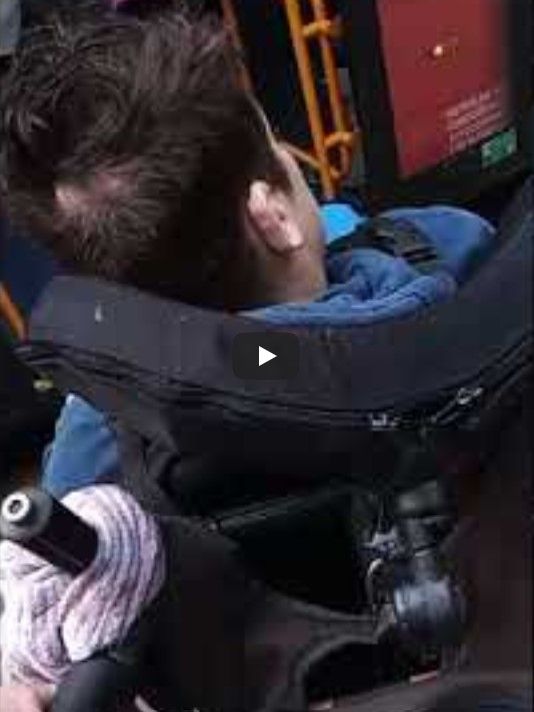
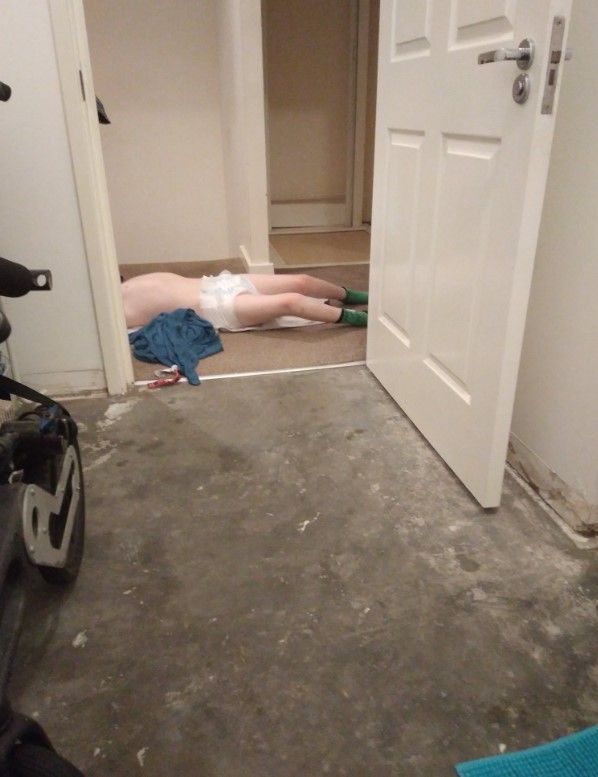
· Disabled respondents and carers in the area gave similar reasons for being negative about the schemes to overall responses. However, many of them linked their concerns to their disability –e.g. longer journeys to health services, the ability of carers to meet appointments, being unable to walk or cycle places due to a disability/health issue.
· For specific schemes, generally older people were less positive about the proposed changes than younger people.
· Women were less positive about the proposed changes than men.
Bruce Grove / West Green Road LTN
Undertaken between 16th August and 17th
September 2021, a total 1,223 people responded to the consultation –1,122 via
the online portal and 101 via paper surveys
Summary of key Demographic information
· Those living within the LTN area were more positive about reducing vehicle traffic in Bruce Grove West Green than negative, however, when asked about specific LTN schemes they were more negative than positive. Residents from Haringey that live outside the LTN area and boundary roads were the most positive towards the changes.
·
Residents living on boundary roads in the LTN
area (including Belmont Road and Downhills Way) were more negative towards the
changes than those living on minor roads within the LTN area and those living
outside the LTN area.
·
Respondents without access to a private car were
more positive than those with access to a private car.
·
Those who currently travel around the area by
driving were more negative about the changes than overall. Those who travel
around the area by cycling or walking with prams/pushchairs/buggies were the
most positive groups when broken down by travel mode.
· Respondents with a physical or mental health condition/illness were more negative about the proposals than those without.
· Disabled respondents and carers in the area gave similar reasons for being negative about the schemes to overall responses. However, many of them linked their concerns to their disability –e.g. longer journeys to health services, the ability of carers to meet appointments, being unable to walk or cycle places due to a disability/health issue.
· Those aged 25-34 and 35-44 were the most positive age groups
· Women were less positive about the proposed changes than men.
· The majority of responses were from residents in the Bruce Grove West Green area. Most respondents not in the Bruce Grove West Green LTN area visit friends, family, or businesses in the area.
· While the survey was filled in by a range of respondents, responses are not representative of the population of the area. Consultation results should be understood within this context. Groups that are underrepresented in the survey include: those without access to a private car; those identifying as “Black/African/Caribbean/Black British” and “Asian/British Asian”; men; and those aged under 34. The number of people who said the had a disability and/or a long term illness is roughly in line with national averages.
St Anns LTN
The consultation process ran between August and September 2021 and during this process 1,078 people responded to a questionnaire about two LTN proposals for the St Ann’s Area.
Summary of key Demographic information
· 69% (747) of participants stated they lived in the St Ann’s area. 59 live on one of the boundary roads outlined above. 26% (284) said they visit friends and family in the area, and 25% said they visit businesses in the area. 2% (25) said they owned a business in the area. It is worth noting a further 28 businesses responded to the business perception survey, meaning at least 53 businesses participated in the process in some form.
· When asked to identify their gender, 47% selected “woman”, whilst 44% selected “man”. 8% preferred not to say, and a small number identified as “non-binary” or “other”.
· The most common age group of respondents was 35-44, which was selected by 45% of people who answer the question. Overall, 55% of those who participated in the process were under the age of 45.
· When the figures on age are compared to the wider ward demographics for St Ann’s, there was a slight overrepresentation of those over the age of 65.
· 67% of those who answered this question, identified as “white”, with “prefer not to say” constituting the second most popular answer.
· There is an underrepresentation of Black/African/Caribbean/Black British individual when compared to the ward level data.
· 15% of participants identifies as having a long term physical or mental health condition, which is broadly in line with what is outlined within the St Ann’s ward profile. When asked to identify their condition, the majority (54%) preferred not to identify their condition.
· 88% of respondents stated English was their main language.
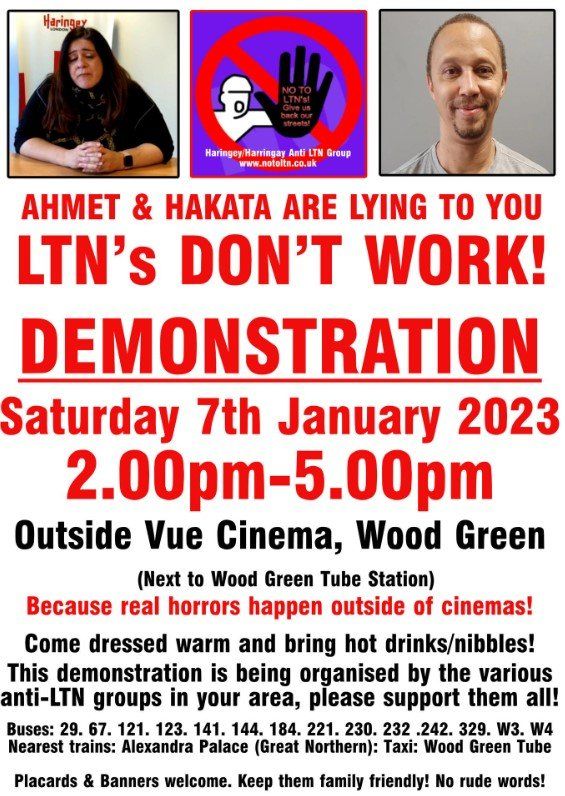
Not a privilege young white healthy male cyclist whose in love with LTNs? About time your voice was heard then - join the protest!